Map of all ISAAC Centres

Original Phase One Synthesis Map

Standardised Phase One Synthesis Map

Graphs & Maps
(Tadd Clayton)
Maps
Beginning in 1993, the ISAAC International Data Centre (IIDC) received data from 156 Phase One centres which were located throughout the world. By 1996 the ISAAC Steering Committee was beginning to prepare publications presenting the large amount of Phase One data from these centres and was considering how the data from so many centres could be presented in a way which provided a useful illustration of global patterns. After some discussion, the Steering Committee chose to use maps of the world with each centre represented by a symbol to indicate prevalence of symptoms.
Once the decision to use maps was made, it was my task as IIDC Data Manager to develop the style of the maps and prepare each map based on the data we had received. My early attempts to prepare maps used SAS which is a very comprehensive statistical analysis package which also includes a component for graphical presentation of data (SAS/Graph). The main advantages of SAS were that it was licensed by the University of Auckland and was thus free for us to use, and that it already included a library of maps. In theory, once I had generated coordinates for each ISAAC centre, I would have been able to use SAS programs to quickly generate each map in an automated manner. However, in practice I found that SAS was difficult to use as there was no way to manually edit the maps.
We decided to instead use a manual method of preparing the maps and purchased Corel Draw 7, a drawing program which would allow fine editing of the maps, and a collection of electronic maps in Adobe Illustrator format (the MapArt collection from Cartesia Software). The main drawback of this approach is that each symbol for the ISAAC centres had to be located manually, although this task did only have to be carried out once as subsequent maps could be based on the first one.
The base map we used is a Mercator projection with Europe and Africa occupying the central part of the map. We certainly cannot be accused of any favouritism towards our own country – this projection places a distorted New Zealand at the extreme lower right of the maps! The base map was modified to remove unnecessary grid lines and names, and to include an enlarged inset section for Europe where there were a large number of centres to plot in a comparatively small area. The location of each centre on the map was identified with the invaluable assistance of the Times Comprehensive Atlas of the World which not only includes many wonderful maps, but also an extremely comprehensive index of towns, cities and regions.
The Steering Committee agreed on a colour scheme for the maps, appropriate colours and shapes for the symbols, and appropriate cut-off values to define prevalence categories. We chose to use strong colours (blue, green, yellow and red illustrating low to high prevalence) and distinctive shapes (square, circle, diamond and star) for the symbols so that the maps would be readable when reproduced in both colour and monochrome (black and white). Each centre was assigned to a prevalence category based on their Phase One results and the appropriate symbol was placed into position on the map.
The maps presented in the ISAAC Phase One worldwide papers were well received and the Steering Committee chose to continue the use of maps in the Phase Three publications. The only major change for Phase Three was to use different shapes for the symbols (triangle, square and inverted triangle) to illustrate changes for the time trends maps.
While the overall layout and colours used for the maps have remained generally consistent, there have been some changes over time. The Phase One maps prepared for the papers used comparatively small symbols which were appropriate for the printed page but were difficult to see when the maps were used in PowerPoint presentations. Additional versions of those maps were prepared with symbols doubled in size to address this problem (see examples right). The larger symbols were exclusively used in all the Phase Three maps. The Phase One and Phase Three maps also used a subtly different colour scheme for the ocean and land which can be attributed to a change in software between the phases (a change from Corel Draw 7 to Adobe Illustrator CS2). The maps presented on this page have been standardised to use the same colours and symbol sizes.
Graphs
As well as the maps, a variety of other graphs were developed in consultation with the writing groups and Steering Committee to present the data from both Phase One and Phase Three. The most common graphs used were ranked prevalence scatter plots and simple scatter plots.
I hope you find these maps and graphs useful and enjoyable to view. As a geographer by training, I particularly enjoyed the process of developing and preparing the maps and feel that they provide a unique and valuable means of viewing and interpreting the ISAAC worldwide data.
All maps and graphs below are standardised from the original ISAAC source data prior to publication in journals and are provided for information only. If you wish to re-use these in presentations or publications, permission must be sought from the relevant journals.
Maps
Phase One Worldmaps
| Asthma Rhinoconjunctivitis Eczema Synthesis | |||
| The International Study of Asthma and Allergies in Childhood (ISAAC) Steering Committee. Worldwide variation in the prevalence of symptoms of asthma, allergic rhinoconjunctivitis, and atopic eczema: ISAAC. The Lancet 1998; 351(9111): 1225-32. | |||
| Figure 6: World map of 12-month prevalences of symptoms of at least two of three disorders Venn diagram shows overall proportions of children with symptoms of asthma, allergic rhinoconjunctivitis, or atopic eczema, or combinations of symptoms. Lancet 1998; 351(9111): 1231. |
 | ||
| Asthma | |||
| The International Study of Asthma and Allergies in Childhood (ISAAC) Steering Committee. Worldwide variations in the prevalence of asthma symptoms: the International Study of Asthma and Allergies in Childhood (ISAAC). Eur Respir J 1998; 12(2): 315-335. | |||
| Figure1. World map for the 1314 yr old age group, showing the percentage of children who answered "yes" to the written question "Have you had wheezing or whistling in the chest in the last 12 months?". Eur Respir J 1998; 12(2): 321 |  | Figure3. World map for the 67 yr old age group, showing the percentage of parents who answered "yes" to the written question "Has your child had wheezing or whistling in the chest in the last 12 months?". Eur Respir J 1998; 12(2): 325 |  |
| Figure 5. World map for the 1314 yr old age group, for the video scene showing a person wheezing while at rest. The percentage of children who answered "yes" to the question "Has your breathing ever been like this... in the last year?" is shown for each centre, with distinct colour symbols used for different prevalence ranges. Eur Respir J 1998; 12(2): 328 |  | ||
| Rhinoconjunctivitis | |||
| Strachan D, Sibbald B, Weiland S, Aït-Khaled N, Anabwani G, Anderson HR, Asher MI, Beasley R, Björkstén B, Burr M, Clayton T, Crane J, Ellwood P, Keil U, Lai C, Mallol J, Martinez F, Mitchell E, Montefort S, Pearce N, Robertson C, Shah J, Stewart A, von Mutius E, Williams H. Worldwide Variations in prevalence of symptoms of allergic rhinoconjunctivitis in children: the International Study of Asthma and Allergies in Childhood (ISAAC). Pediatr Allergy Immunol 1997; 8(4): 161-76. | |||
| Figure 5. Global map of the prevalence of rhinoconjunctivitis in 6-7-year-old children in ISAAC centres. Pediatr Allergy Immunol 1997; 8(4): 166 |  |
Figure6. Global map of the prevalence of rhinoconjunctivitis in 13-14-year-old children in ISAAC centres. Pediatr Allergy Immunol 1997; 8(4): 166 |  |
| Eczema | |||
| Williams H, Robertson C, Stewart A, Aït-Khaled N, Anabwani G, Anderson HR, Asher MI, Beasley R, Björkstén B, Burr M, Clayton T, Crane J, Ellwood P, Keil U, Lai C, Mallol J, Martinez F, Mitchell E, Montefort S, Pearce N, Shah J, Sibbald B, Strachan D, von Mutius E and Weiland S. Worldwide variations in the prevalence of symptoms of atopic eczema in the international study of asthma and allergies in childhood. J Allergy Clin Immunol 1999; 103(1 Pt 1): 125-38. | |||
| Figure1. Global map of symptoms of atopic eczema in the last 12 months in 458,623 children aged 13 to 14 years in 153 centers in 56 countries. J Allergy Clin Immunol 1999;103:127 |  | Figure2. Global map of symptoms of atopic eczema in the last 12 months in 256,410 children in aged 6 to 7 years in 90 centers in 37 countries. J Allergy Clin Immunol 1999;103:127 |  |
Phase Three Time Trends
| Asthma Rhinoconjunctivitis Eczema | |||
| Asher MI, Montefort S, Björkstén B, Lai CKW, Strachan DP, Weiland SK, Williams H, and the ISAAC Phase Three Study Group. Worldwide time trends in the prevalence of symptoms of asthma, allergic rhinoconjunctivitis, and eczema in childhood: ISAAC Phases One and Three repeat multicountry cross-sectional surveys. The Lancet 2006; 368(9537): 733-743. | |||
| Figure 2: World map showing direction of change in prevalence of asthma symptoms for 67 year age-group and 1314 year age-group Each symbol represents a centre. Blue triangle=prevalence reduced by ≥1 SE per year. Green square=little change (<1 SE). Red triangle=prevalence increased by ≥1 SE per year. Lancet 2006; 368(9537): 738 |  6-7 years |
 13-14 years | |
| Figure 3: World map showing direction of change in prevalence of allergic rhinoconjunctivitis symptoms for 6–7 year age-group and 13–14 year age-group. Each symbol represents a centre. Blue triangle=prevalence reduced by ≥1 SE per year. Green square=little change (<1 SE). Red triangle=prevalence increased by ≥1 SE per year. Lancet 2006; 368(9537): 739 |  6-7 years view / download |
 13-14 years view | download | |
| Figure 4: World map showing direction of change in prevalence of eczema symptoms for 6–7 year age-group and 13–14 year age-group. Each symbol represents a centre. Blue triangle=prevalence reduced by ≥1 SE per year. Green square=little change (<1 SE). Red triangle=prevalence increased by ≥1 SE per year. Lancet 2006; 368(9537): 740 |  6-7 years |
 13-14 years view | download |
|
| Eczema | |||
| Williams H, Stewart A, von Mutius E, Cookson B, Anderson HR and the International Study of Asthma and Allergies in Childhood (ISAAC) Phase One and Three Study groups. Is eczema really on the increase worldwide? J Allergy Clin Immunol 2008; 121(4): 947-54. | |||
| Figure2. World maps of flexural eczema symptoms in the last year showing changes in the prevalence of eczema symptoms for 13- to 14-year-olds (A) and 6- to 7-year-olds (B) in consecutive prevalence surveys conducted 5 to 10 years apart. J Allergy Clin Immunol 2008; 121(4): 951-2 |  Fig.2A |  Fig.2B | |
Phase Three Worldmaps
| Asthma | |||
| Lai CKW, Beasley R, Crane J, Foliaki S, Shah J, Weiland S, and the ISAAC Phase Three Study Group. Global variation in the prevalence and severity of asthma symptoms: Phase Three of the International Study of Asthma and Allergies in Childhood (ISAAC). Thorax 2009; 64: 476483. |
|||
| Figure 1. Prevalence of current wheeze according to the written questionnaire in the 13–14 year age group. Thorax 2009; 64: 478 |  |
Figure 2. Prevalence of symptoms of severe asthma according to the written questionnaire in the 13–14 year age group. Thorax 2009; 64: 479 |  |
| Figure 3. Prevalence of current wheeze in the 6–7 year age group. Thorax 2009; 64: 480 |  |
Figure 4. Prevalence of symptoms of severe asthma in the 6–7 year age group. Thorax 2009; 64: 481 |  |
| Figure S1. Prevalence of symptoms of severe asthma amongst wheezers in the past 12 months in 13-14 year age group. Thorax 2009; 64: 476-483 online material |  |
Figure S2. Prevalence of unreported asthma amongst wheezers with symptoms of severe asthma in the past 12 months in 13-14 year age group. Thorax 2009; 64: 476-483 online material |  |
| Figure S3. Prevalence of symptoms of severe asthma amongst wheezers in the past 12 months in 6-7 year age group. Thorax 2009; 64: 476-483 online material |  |
||
| Rhinoconjunctivitis | |||
| Aït-Khaled N. Pearce N. Anderson HR. Ellwood P. Montefort S. Shah J. and the ISAAC Phase Three Study Group. Global map of the prevalence of symptoms of rhinoconjunctivitis in children: The International Study of Asthma and Allergies in Childhood (ISAAC) Phase Three. Allergy 2009; 64: 123148 |
|||
| Figure 1. Map of prevalence of current symptoms of rhinoconjunctivitis, 13- to 14-year age group. Allergy 2009; 64: 133 |  |
Figure 3. Map of prevalence of current symptoms of rhinoconjunctivitis, 6- to 7-year age group. Allergy 2009; 64: 141 |  |
| Eczema | |||
| Odhiambo J, Williams H, Clayton T, Robertson C, Asher MI, and the ISAAC Phase Three Study group. Global variations in prevalence of eczema symptoms in children from ISAAC Phase Three. J Allergy Clin Immunol. 2009;124(6):1251-8. |
|||
| Figure1 World maps showing prevalence of current symptoms of eczema for the age group 6 to 7 years (A) and 13 to 14 years (B). Each symbol represents a center. Allergy Clin Immunol. 2009;124(6):1253 |  Fig1A |
 Fig1B |
|
| Figure E2. World maps showing prevalence of current symptoms of severe eczema for the age groups 6 to 7 years (A) and 13 to 14 years (B). Each symbol represents a center. J Allergy Clin Immunol. 2009;124(6):1258.e4 |  Fig.E2A |
 Fig.E2B |
|
Graphs
Phase One Worldmap Papers
| Asthma Rhinoconjunctivitis Eczema Synthesis | |||
| The International Study of Asthma and Allergies in Childhood (ISAAC) Steering Committee. Worldwide variation in the prevalence of symptoms of asthma, allergic rhinoconjunctivitis, and atopic eczema: ISAAC. The Lancet 1998; 351(9111): 1225-32. | |||
| Figure 1: 12-month prevalences of self-reported asthma symptoms from written questionnaires |  view / download |
Figure 2: 12-month prevalences of asthma symptoms from video questionnaires |  view / download |
| Figure 3: 12-month prevalences of allergic rhinoconjunctivitis symptoms |  view / download |
Figure 4: 12-month prevalences of atopic eczema symptoms |  view / download |
| Figure 5: Scatter plots of 12-month prevalences of symptoms from written questionnaires |  view / download | ||
| Asthma | |||
| The International Study of Asthma and Allergies in Childhood (ISAAC) Steering Committee. Worldwide variations in the prevalence of asthma symptoms: the International Study of Asthma and Allergies in Childhood (ISAAC). Eur Respir J 1998; 12(2): 315-335. | |||
| Figure 2: Ranking of participating countries for the percentage who answered positively to the question "In the last 12 months, how often, on average, has your (child's) sleep been disturbed due to wheezing?: one or more nights per week" for: a) the 1314 yr olds; and b) the 67 yr olds. |  Fig 2A view / download |
 Fig 2B view / download | |
| Figure 4: Scatter plots for centres for the percentage of children who have had "wheezing or whistling in the chest in the last 12 months". The x-axis shows self-reported wheezing in 1314 yr olds and the y-axis wheezing reported by parents in 67 yr olds. The line of identity is shown. |  view / download | Figure 6: Scatter plots for the percentage of the 1314 yr old age group responding "yes" for wheezing in the last year (video questionnaire) against "wheezing or whistling in the chest in the last 12 months". The x-axis shows wheezing for the written questionnaire and the y-axis wheezing for the video questionnaire. The line of identity is shown. |  view / download |
| Rhinoconjunctivitis | |||
| Strachan D, Sibbald B, Weiland S, Aït-Khaled N, Anabwani G, Anderson HR, Asher MI, Beasley R, Björkstén B, Burr M, Clayton T, Crane J, Ellwood P, Keil U, Lai C, Mallol J, Martinez F, Mitchell E, Montefort S, Pearce N, Robertson C, Shah J, Stewart A, von Mutius E, Williams H. Worldwide Variations in prevalence of symptoms of allergic rhinoconjunctivitis in children: the International Study of Asthma and Allergies in Childhood (ISAAC). Pediatr Allergy Immunol 1997; 8(4): 161-76. | |||
| Figure 1: Scatter plot comparing prevalence of hay fever and prevalence of rhinoconjunctivitis across ISAAC centres in 6-7-year-olds. |  view / download |
Figure 2: Scatter plot comparing prevalence of hay fever and prevalence of rhinoconjunctivitis across ISAAC centres in 13-14-year-olds. |  view / download |
| Figure 3: Scatter plot comparing the prevalence of rhinoconjunctivitis in each age group across ISAAC centres. |  view / download |
Figure 4: Scatter plot comparing the lifetime prevalence of hay fever in each age group across ISAAC centres. |  view / download |
Phase Three Time Trends Papers
| Asthma Rhinoconjunctivitis Eczema | |||
| Asher MI, Montefort S, Björkstén B, Lai CKW, Strachan DP, Weiland SK, Williams H, and the ISAAC Phase Three Study Group. Worldwide time trends in the prevalence of symptoms of asthma, allergic rhinoconjunctivitis, and eczema in childhood: ISAAC Phases One and Three repeat multicountry cross-sectional surveys. The Lancet 2006; 368(9537): 733-743. | |||
| Figure 1: Bland-Altman plots showing mean change in prevalence of symptoms of asthma, allergic rhinoconjunctivitis, and eczema per year for 67 year age-group and 1314 year age-group versus mean prevalence of Phases One and Three for each centre |  view / download |
||
| Asthma | |||
| Pearce N, Aït-Khaled N, Beasley R, Mallol J, Keil U, Mitchell E, Robertson C, and the ISAAC Phase Three Study Group. Worldwide trends in the prevalence of asthma symptoms: Phase III of the International Study of Asthma and Allergies in Childhood (ISAAC). Thorax 2007; 62(9): 758-66. view Article | view Editorial | |||
| Figure 1 Ranking plot showing the change per year in prevalence of current wheeze (wheeze in the past 12 months) in children aged 1314 years for each centre by country, with countries ordered by their mean prevalence (for all centres combined) across phase I and phase III. The plot also shows the confidence interval about zero change for a given level of prevalence (ie, the mean prevalence across phases I and III) given a sample size of 3000 and no cluster sampling effect. |  view / download | Figure 2 Ranking plot showing the change per year in prevalence of >4 attacks of wheezing in the previous 12 months in children aged 1314 years for each centre by country, with countries ordered by their average prevalence (for all centres combined) across phase I and phase III. The plot also shows the confidence interval about zero change for a given level of prevalence (ie, the mean prevalence across phases I and III) given a sample size of 3000 and no cluster sampling effect. |  view / download |
| Figure 3 Ranking plot showing the change per year in the lifetime prevalence of asthma (asthma ever) in children aged 1314 years for each centre by country, with countries ordered by their mean prevalence (for all centres combined) across phase I and phase III. The plot also shows the confidence interval about zero change for a given level of prevalence (ie, the mean prevalence across phases I and III) given a sample size of 3000 and no cluster sampling effect. |  view / download | Figure 4 Ranking plot showing the change per year in prevalence of current wheeze (wheeze in the past 12 months) using the video questionnaire in children aged 1314 years for each centre by country, with countries ordered by their mean prevalence (for all centres combined) across phase I and phase III. The plot also shows the confidence interval about zero change for a given level of prevalence (ie, the mean prevalence across phases I and III) given a sample size of 3000 and no cluster sampling effect. |  view / download |
| Figure 5 Ranking plot showing the change per year in the prevalence of current wheeze (wheeze in the past 12 months) in children aged 67 years for each centre by country, with countries ordered by their mean prevalence (for all centres combined) across phase I and phase III. The plot also shows the confidence interval about zero change for a given level of prevalence (ie, the mean prevalence across phases I and III) given a sample size of 3000 and no cluster sampling effect. |  view / download | Figure 6 Ranking plot showing the change per year in prevalence of >4 attacks of wheezing in the previous 12 months in children aged 67 years for each centre by country, with countries ordered by their mean prevalence (for all centres combined) across phase I and phase III. The plot also shows the confidence interval about zero change for a given level of prevalence (ie, the mean prevalence across phases I and III) given a sample size of 3000 and no cluster sampling effect. |  view / download |
| Figure 7 Ranking plot showing the change per year in the lifetime prevalence of asthma (asthma ever) in children aged 67 years for each centre by country, with countries ordered by their mean prevalence (for all centres combined) across phase I and phase III. The plot also shows the confidence interval about zero change for a given level of prevalence (ie, the mean prevalence across phases I and III) given a sample size of 3000 and no cluster sampling effect. |  Fig 2A view / download |
||
| Rhinoconjunctivitis | |||
| Björkstén B, Clayton T, Ellwood P, Stewart A, Strachan D, and the ISAAC Phase Three Study Group. Worldwide time trends for symptoms of rhinitis and conjunctivitis: Phase III of the International Study of Asthma and Allergies in Childhood. Pediatr Allergy Immunol 2008; 19(2): 110-24. view full article | |||
| Figure 1: Ranking plot showing the change per year of symptoms of rhinitis in 13- to 14-yr-old children for each centre by country, with countries ordered by their average prevalence (for all centres combined) across Phase I and Phase III. The plot also shows the confidence interval about zero change for a given level of prevalence, given a sample size of at least 3000 and no cluster sampling effect. |  view / download |
Figure 2: Ranking plot showing the change per year of symptoms of rhinitis in 6- to 7-yr-old children for each centre by country, with countries ordered by their average prevalence (for all centres combined) across Phase I and Phase III (c.f. Fig. 1). |  view / download |
| Figure 3: Ranking plot showing the change per year of symptoms of rhinoconjunctivitis (affirmative responses to both the questions 'In the past 12 months, have you had a problem with sneezing or a runny or blocked nose, when you DID NOT have a cold or 'the flu'?' and 'In the past 12 months, has this nose problem been accompanied by itchy-watery eyes?') in 13- to 14-yr-old children for each centre by country, with countries ordered by their average prevalence (for all centres combined) across Phase I and Phase III (c.f. Fig. 1). |  view / download |
Figure 4: Ranking plot showing the change per year of symptoms of rhinoconjunctivitis (affirmative responses to both the questions 'In the past 12 months, have you had a problem with sneezing or a runny or blocked nose, when you DID NOT have a cold or 'the flu'?' and 'In the past 12 months, has this nose problem been accompanied by itchy-watery eyes?') in 6- to 7- yr-old children for each centre by country, with countries ordered by their average prevalence (for all centres combined) across Phase I and Phase III (c.f. Fig. 1). |  view / download |
| Figure 5: Scatter plot showing the change per year of symptoms of rhinoconjunctivitis for the 1314 yr age group and the 67 yr age group for centres which included both age groups. |  view / download | ||
| Eczema | |||
| Williams H, Stewart A, von Mutius E, Cookson B, Anderson HR and the International Study of Asthma and Allergies in Childhood (ISAAC) Phase One and Three Study groups. Is eczema really on the increase worldwide? J Allergy Clin Immunol 2008; 121(4): 947-54. | |||
| Figure 1. Ranking plots depicting annual change in eczema prevalence (defined as symptoms of flexural eczema in the last year) between the 2 ISAAC surveys on the horizontal axis against average prevalence between the 2 surveys on the vertical axis. A, Children 13 to 14 years old. B, Children 6 to 7 years old. Countries are ordered by ascending average prevalence. The dashed lines denote 95% CIs about zero change for a given prevalence level, given a sample size of 3000 and no cluster sampling effect. Red diamond points denote countries that used English-language questionnaires. |  Fig.1A |  Fig.1B | |
| Figure E1. Ranking plots of changes in symptoms of severe eczema for 13- and 14-year-olds ordered by average prevalence. |  view / download |
Figure E2. Ranking plots of changes in symptoms of reporting the disease label of eczema for 13- and 14-yearolds ordered by average prevalence. |  view / download |
| Figure E3. Ranking plots of changes in symptoms of severe eczema for 6- and 7-year olds ordered by average prevalence. |  view / download |
Figure E4. Ranking plots of changes in symptoms of reporting the disease label of eczema for 6- and 7-year olds ordered by average prevalence. |  view / download |
Phase Three Worldmap Papers
| Rhinoconjunctivitis | |||
| Aït-Khaled N. Pearce N. Anderson HR. Ellwood P. Montefort S. Shah J. and the ISAAC Phase Three Study Group. Global map of the prevalence of symptoms of rhinoconjunctivitis in children: The International Study of Asthma and Allergies in Childhood (ISAAC) Phase Three. Allergy 2009; 64: 123148 |
|||
| Figure 2. Prevalence of current symptoms of rhinoconjunctivitis, 13- to 14-year age group. Countries are ordered by average prevalence. |  view / download |
Figure 4. Prevalence of current symptoms of rhinoconjunctivitis, 6- to 7-year age group. Countries are ordered by average prevalence. | 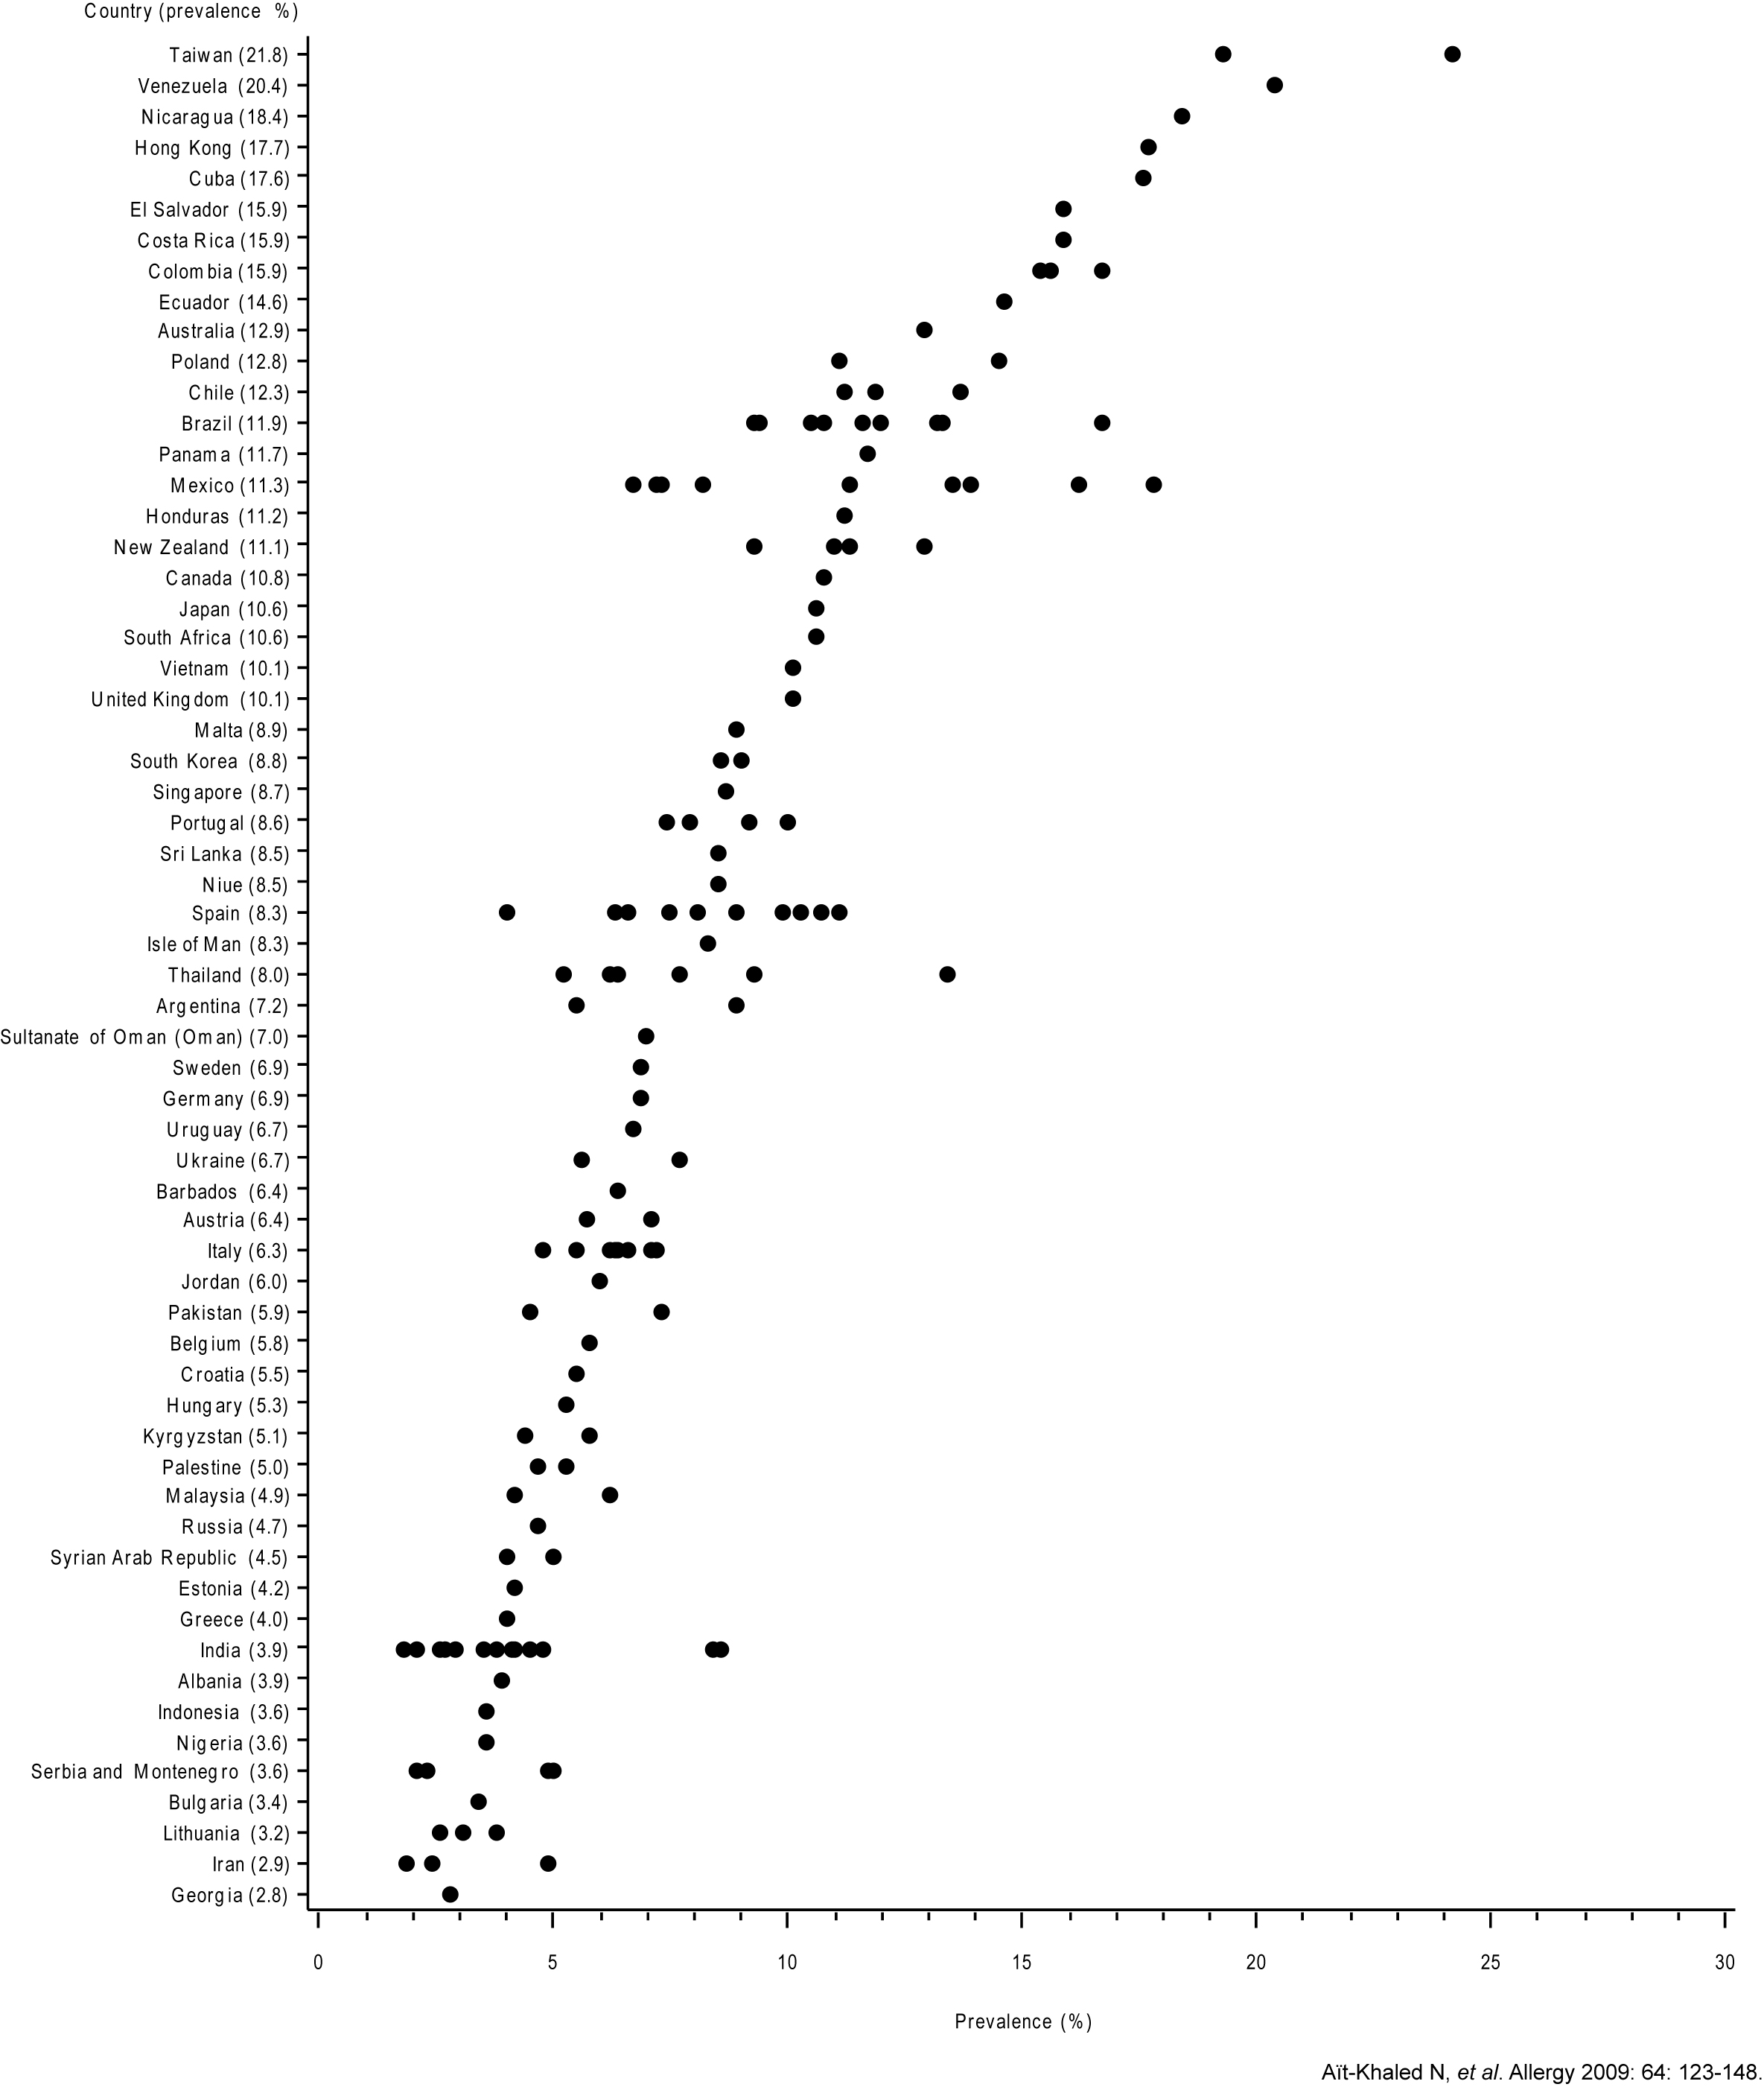 view / download |
| Figure 5. Scatter plot of prevalence of current symptoms of rhinoconjunctivitis, both age groups. |  view / download | ||
| Eczema | |||
| Odhiambo J, Williams H, Clayton T, Robertson C, Asher MI, and the ISAAC Phase Three Study group. Global variations in prevalence of eczema symptoms in children from ISAAC Phase Three. J Allergy Clin Immunol. 2009;124(6):1251-8. |
|||
| FIG 2. Ranked prevalence plots of current symptoms of eczema for the age group 6 to 7 years (A) and 13 to 14 years (B). Each symbol represents a center. Countries are ordered by average prevalence. |  Fig2A |
 Fig2B |
|
| FIG E3. Ranked prevalence plots of current symptoms of eczema for the age groups 6 to 7 years (A) and 13 to 14 years (B). Each symbol represents a center. Regions are ordered by average prevalence. |  Fig.E3A |
 Fig.E3B |
|
| FIG E4. Ranked prevalence plots of current symptoms of severe eczema for the age groups 6 to 7 years (A) and 13 to 14 years (B). Each symbol represents a center. Countries are ordered by average prevalence. |  Fig.E4A |
 Fig.E4B |
|
| FIG E5. Ranked prevalence plots of lifetime reported eczema for the age groups 6 to 7 years (A) and 13 to 14 years (B). Each symbol represents a center. Countries are ordered by average prevalence. |  Fig.E5A |
 Fig.E5B |
|
| FIG E6. Scatter plots illustrating prevalence by sex for current symptoms of eczema (A), current symptoms of severe eczema (B), and lifetime reported "eczema" (C) for the age group 6 to 7 years, and current symptoms of eczema (D), current symptoms of severe eczema (E), and lifetime reported "eczema" (F) for the age group 13 to 14 years. Each symbol represents a center. The line of equality is shown on each plot. |  Fig.E6A-C |
 Fig.E6D-F |
|
All Figures
Phase One Worldmap Papers
| Asthma Rhinoconjunctivitis Eczema Synthesis | |||
| The International Study of Asthma and Allergies in Childhood (ISAAC) Steering Committee. Worldwide variation in the prevalence of symptoms of asthma, allergic rhinoconjunctivitis, and atopic eczema: ISAAC. The Lancet 1998; 351(9111): 1225-32. | |||
| Figure 1: 12-month prevalences of self-reported asthma symptoms from written questionnaires | view / download |
Figure 2: 12-month prevalences of asthma symptoms from video questionnaires | view / download |
| Figure 3: 12-month prevalences of allergic rhinoconjunctivitis symptoms | view / download |
Figure 4: 12-month prevalences of atopic eczema symptoms | view / download |
| Figure 5: Scatter plots of 12-month prevalences of symptoms from written questionnaires | view / download |
Figure 6: World map of 12-month prevalences of symptoms of at least two of three disorders Venn diagram shows overall proportions of children with symptoms of asthma, allergic rhinoconjunctivitis, or atopic eczema, or combinations of symptoms. Lancet 1998; 351(9111): 1231. |
|
| Hide all Figures | |||
| Asthma | |||
| The International Study of Asthma and Allergies in Childhood (ISAAC) Steering Committee. Worldwide variations in the prevalence of asthma symptoms: the International Study of Asthma and Allergies in Childhood (ISAAC). Eur Respir J 1998; 12(2): 315-335. | |||
| Figure1. World map for the 1314 yr old age group, showing the percentage of children who answered "yes" to the written question "Have you had wheezing or whistling in the chest in the last 12 months?". Eur Respir J 1998; 12(2): 321 | | ||
| Figure 2: Ranking of participating countries for the percentage who answered positively to the question "In the last 12 months, how often, on average, has your (child's) sleep been disturbed due to wheezing?: one or more nights per week" for: a) the 1314 yr olds; and b) the 67 yr olds. | Fig 2A view / download |
Fig 2B view / download | |
| Figure3. World map for the 67 yr old age group, showing the percentage of parents who answered "yes" to the written question "Has your child had wheezing or whistling in the chest in the last 12 months?". Eur Respir J 1998; 12(2): 325 | | Figure 4: Scatter plots for centres for the percentage of children who have had "wheezing or whistling in the chest in the last 12 months". The x-axis shows self-reported wheezing in 1314 yr olds and the y-axis wheezing reported by parents in 67 yr olds. The line of identity is shown. | view / download |
| Figure 5. World map for the 1314 yr old age group, for the video scene showing a person wheezing while at rest. The percentage of children who answered "yes" to the question "Has your breathing ever been like this... in the last year?" is shown for each centre, with distinct colour symbols used for different prevalence ranges. Eur Respir J 1998; 12(2): 328 | | Figure 6: Scatter plots for the percentage of the 1314 yr old age group responding "yes" for wheezing in the last year (video questionnaire) against "wheezing or whistling in the chest in the last 12 months". The x-axis shows wheezing for the written questionnaire and the y-axis wheezing for the video questionnaire. The line of identity is shown. | view / download |
| Rhinoconjunctivitis | |||
| Strachan D, Sibbald B, Weiland S, Aït-Khaled N, Anabwani G, Anderson HR, Asher MI, Beasley R, Björkstén B, Burr M, Clayton T, Crane J, Ellwood P, Keil U, Lai C, Mallol J, Martinez F, Mitchell E, Montefort S, Pearce N, Robertson C, Shah J, Stewart A, von Mutius E, Williams H. Worldwide Variations in prevalence of symptoms of allergic rhinoconjunctivitis in children: the International Study of Asthma and Allergies in Childhood (ISAAC). Pediatr Allergy Immunol 1997; 8(4): 161-76. | |||
| Figure 1: Scatter plot comparing prevalence of hay fever and prevalence of rhinoconjunctivitis across ISAAC centres in 6-7-year-olds. | view / download |
Figure 2: Scatter plot comparing prevalence of hay fever and prevalence of rhinoconjunctivitis across ISAAC centres in 13-14-year-olds. | view / download |
| Figure 3: Scatter plot comparing the prevalence of rhinoconjunctivitis in each age group across ISAAC centres. | view / download |
Figure 4: Scatter plot comparing the lifetime prevalence of hay fever in each age group across ISAAC centres. | view / download |
| Figure 5. Global map of the prevalence of rhinoconjunctivitis in 6-7-year-old children in ISAAC centres. Pediatr Allergy Immunol 1997; 8(4): 166 | |
Figure6. Global map of the prevalence of rhinoconjunctivitis in 13-14-year-old children in ISAAC centres. Pediatr Allergy Immunol 1997; 8(4): 166 | |
| Eczema | |||
| Williams H, Robertson C, Stewart A, Aït-Khaled N, Anabwani G, Anderson HR, Asher MI, Beasley R, Björkstén B, Burr M, Clayton T, Crane J, Ellwood P, Keil U, Lai C, Mallol J, Martinez F, Mitchell E, Montefort S, Pearce N, Shah J, Sibbald B, Strachan D, von Mutius E and Weiland S. Worldwide variations in the prevalence of symptoms of atopic eczema in the international study of asthma and allergies in childhood. J Allergy Clin Immunol 1999; 103(1 Pt 1): 125-38. | |||
| Figure1. Global map of symptoms of atopic eczema in the last 12 months in 458,623 children aged 13 to 14 years in 153 centers in 56 countries. J Allergy Clin Immunol 1999;103:127 | |
Figure2. Global map of symptoms of atopic eczema in the last 12 months in 256,410 children in aged 6 to 7 years in 90 centers in 37 countries. J Allergy Clin Immunol 1999;103:127 | |
Phase Three Time Trends Papers
| Asthma Rhinoconjunctivitis Eczema | |||
| Asher MI, Montefort S, Björkstén B, Lai CKW, Strachan DP, Weiland SK, Williams H, and the ISAAC Phase Three Study Group. Worldwide time trends in the prevalence of symptoms of asthma, allergic rhinoconjunctivitis, and eczema in childhood: ISAAC Phases One and Three repeat multicountry cross-sectional surveys. The Lancet 2006; 368(9537): 733-743. | |||
| Figure 1: Bland-Altman plots showing mean change in prevalence of symptoms of asthma, allergic rhinoconjunctivitis, and eczema per year for 67 year age-group and 1314 year age-group versus mean prevalence of Phases One and Three for each centre | view / download |
||
| Figure 2: World map showing direction of change in prevalence of asthma symptoms for 67 year age-group and 1314 year age-group Each symbol represents a centre. Blue triangle=prevalence reduced by ≥1 SE per year. Green square=little change (<1 SE). Red triangle=prevalence increased by ≥1 SE per year. Lancet 2006; 368(9537): 738 | 6-7 years |
13-14 years | |
| Figure 3: World map showing direction of change in prevalence of allergic rhinoconjunctivitis symptoms for 6–7 year age-group and 13–14 year age-group. Each symbol represents a centre. Blue triangle=prevalence reduced by ≥1 SE per year. Green square=little change (<1 SE). Red triangle=prevalence increased by ≥1 SE per year. Lancet 2006; 368(9537): 739 | 6-7 years view / download |
13-14 years view | download | |
| Figure 4: World map showing direction of change in prevalence of eczema symptoms for 6–7 year age-group and 13–14 year age-group. Each symbol represents a centre. Blue triangle=prevalence reduced by ≥1 SE per year. Green square=little change (<1 SE). Red triangle=prevalence increased by ≥1 SE per year. Lancet 2006; 368(9537): 740 | 6-7 years |
13-14 years view | download |
|
| Asthma | |||
| Pearce N, Aït-Khaled N, Beasley R, Mallol J, Keil U, Mitchell E, Robertson C, and the ISAAC Phase Three Study Group. Worldwide trends in the prevalence of asthma symptoms: Phase III of the International Study of Asthma and Allergies in Childhood (ISAAC). Thorax 2007; 62(9): 758-66. view Article | view Editorial | |||
| Figure 1 Ranking plot showing the change per year in prevalence of current wheeze (wheeze in the past 12 months) in children aged 1314 years for each centre by country, with countries ordered by their mean prevalence (for all centres combined) across phase I and phase III. The plot also shows the confidence interval about zero change for a given level of prevalence (ie, the mean prevalence across phases I and III) given a sample size of 3000 and no cluster sampling effect. | view / download | Figure 2 Ranking plot showing the change per year in prevalence of >4 attacks of wheezing in the previous 12 months in children aged 1314 years for each centre by country, with countries ordered by their average prevalence (for all centres combined) across phase I and phase III. The plot also shows the confidence interval about zero change for a given level of prevalence (ie, the mean prevalence across phases I and III) given a sample size of 3000 and no cluster sampling effect. | view / download |
| Figure 3 Ranking plot showing the change per year in the lifetime prevalence of asthma (asthma ever) in children aged 1314 years for each centre by country, with countries ordered by their mean prevalence (for all centres combined) across phase I and phase III. The plot also shows the confidence interval about zero change for a given level of prevalence (ie, the mean prevalence across phases I and III) given a sample size of 3000 and no cluster sampling effect. | view / download | Figure 4 Ranking plot showing the change per year in prevalence of current wheeze (wheeze in the past 12 months) using the video questionnaire in children aged 1314 years for each centre by country, with countries ordered by their mean prevalence (for all centres combined) across phase I and phase III. The plot also shows the confidence interval about zero change for a given level of prevalence (ie, the mean prevalence across phases I and III) given a sample size of 3000 and no cluster sampling effect. | view / download |
| Figure 5 Ranking plot showing the change per year in the prevalence of current wheeze (wheeze in the past 12 months) in children aged 67 years for each centre by country, with countries ordered by their mean prevalence (for all centres combined) across phase I and phase III. The plot also shows the confidence interval about zero change for a given level of prevalence (ie, the mean prevalence across phases I and III) given a sample size of 3000 and no cluster sampling effect. | view / download | Figure 6 Ranking plot showing the change per year in prevalence of >4 attacks of wheezing in the previous 12 months in children aged 67 years for each centre by country, with countries ordered by their mean prevalence (for all centres combined) across phase I and phase III. The plot also shows the confidence interval about zero change for a given level of prevalence (ie, the mean prevalence across phases I and III) given a sample size of 3000 and no cluster sampling effect. | view / download |
| Figure 7 Ranking plot showing the change per year in the lifetime prevalence of asthma (asthma ever) in children aged 67 years for each centre by country, with countries ordered by their mean prevalence (for all centres combined) across phase I and phase III. The plot also shows the confidence interval about zero change for a given level of prevalence (ie, the mean prevalence across phases I and III) given a sample size of 3000 and no cluster sampling effect. | Fig 2A view / download |
||
| Rhinoconjunctivitis | |||
| Björkstén B, Clayton T, Ellwood P, Stewart A, Strachan D, and the ISAAC Phase Three Study Group. Worldwide time trends for symptoms of rhinitis and conjunctivitis: Phase III of the International Study of Asthma and Allergies in Childhood. Pediatr Allergy Immunol 2008; 19(2): 110-24. view full article | |||
| Figure 1: Ranking plot showing the change per year of symptoms of rhinitis in 13- to 14-yr-old children for each centre by country, with countries ordered by their average prevalence (for all centres combined) across Phase I and Phase III. The plot also shows the confidence interval about zero change for a given level of prevalence, given a sample size of at least 3000 and no cluster sampling effect. | view / download |
Figure 2: Ranking plot showing the change per year of symptoms of rhinitis in 6- to 7-yr-old children for each centre by country, with countries ordered by their average prevalence (for all centres combined) across Phase I and Phase III (c.f. Fig. 1). | view / download |
| Figure 3: Ranking plot showing the change per year of symptoms of rhinoconjunctivitis (affirmative responses to both the questions 'In the past 12 months, have you had a problem with sneezing or a runny or blocked nose, when you DID NOT have a cold or 'the flu'?' and 'In the past 12 months, has this nose problem been accompanied by itchy-watery eyes?') in 13- to 14-yr-old children for each centre by country, with countries ordered by their average prevalence (for all centres combined) across Phase I and Phase III (c.f. Fig. 1). | view / download |
Figure 4: Ranking plot showing the change per year of symptoms of rhinoconjunctivitis (affirmative responses to both the questions 'In the past 12 months, have you had a problem with sneezing or a runny or blocked nose, when you DID NOT have a cold or 'the flu'?' and 'In the past 12 months, has this nose problem been accompanied by itchy-watery eyes?') in 6- to 7- yr-old children for each centre by country, with countries ordered by their average prevalence (for all centres combined) across Phase I and Phase III (c.f. Fig. 1). | view / download |
| Figure 5: Scatter plot showing the change per year of symptoms of rhinoconjunctivitis for the 1314 yr age group and the 67 yr age group for centres which included both age groups. | view / download | ||
| Eczema | |||
| Williams H, Stewart A, von Mutius E, Cookson B, Anderson HR and the International Study of Asthma and Allergies in Childhood (ISAAC) Phase One and Three Study groups. Is eczema really on the increase worldwide? J Allergy Clin Immunol 2008; 121(4): 947-54. | |||
| Figure 1. Ranking plots depicting annual change in eczema prevalence (defined as symptoms of flexural eczema in the last year) between the 2 ISAAC surveys on the horizontal axis against average prevalence between the 2 surveys on the vertical axis. A, Children 13 to 14 years old. B, Children 6 to 7 years old. Countries are ordered by ascending average prevalence. The dashed lines denote 95% CIs about zero change for a given prevalence level, given a sample size of 3000 and no cluster sampling effect. Red diamond points denote countries that used English-language questionnaires. | Fig.1A | Fig.1B | |
| Figure2. World maps of flexural eczema symptoms in the last year showing changes in the prevalence of eczema symptoms for 13- to 14-year-olds (A) and 6- to 7-year-olds (B) in consecutive prevalence surveys conducted 5 to 10 years apart. J Allergy Clin Immunol 2008; 121(4): 951-2 | Fig.2A | Fig.2B | |
| Figure E1. Ranking plots of changes in symptoms of severe eczema for 13- and 14-year-olds ordered by average prevalence. | view / download |
Figure E2. Ranking plots of changes in symptoms of reporting the disease label of eczema for 13- and 14-yearolds ordered by average prevalence. | view / download |
| Figure E3. Ranking plots of changes in symptoms of severe eczema for 6- and 7-year olds ordered by average prevalence. | view / download |
Figure E4. Ranking plots of changes in symptoms of reporting the disease label of eczema for 6- and 7-year olds ordered by average prevalence. | view / download |
Phase Three Worldmap Papers
| Asthma | |||
| Lai CKW, Beasley R, Crane J, Foliaki S, Shah J, Weiland S, and the ISAAC Phase Three Study Group. Global variation in the prevalence and severity of asthma symptoms: Phase Three of the International Study of Asthma and Allergies in Childhood (ISAAC). Thorax 2009; 64: 476483. |
|||
| Figure 1. Prevalence of current wheeze according to the written questionnaire in the 13–14 year age group. Thorax 2009; 64: 478 | |
Figure 2. Prevalence of symptoms of severe asthma according to the written questionnaire in the 13–14 year age group. Thorax 2009; 64: 479 | |
| Figure 3. Prevalence of current wheeze in the 6–7 year age group. Thorax 2009; 64: 480 | |
Figure 4. Prevalence of symptoms of severe asthma in the 6–7 year age group. Thorax 2009; 64: 481 | |
| Figure S1. Prevalence of symptoms of severe asthma amongst wheezers in the past 12 months in 13-14 year age group. Thorax 2009; 64: 476-483 online material | |
Figure S2. Prevalence of unreported asthma amongst wheezers with symptoms of severe asthma in the past 12 months in 13-14 year age group. Thorax 2009; 64: 476-483 online material | |
| Figure S3. Prevalence of symptoms of severe asthma amongst wheezers in the past 12 months in 6-7 year age group. Thorax 2009; 64: 476-483 online material | |
||
| Rhinoconjunctivitis | |||
| Aït-Khaled N. Pearce N. Anderson HR. Ellwood P. Montefort S. Shah J. and the ISAAC Phase Three Study Group. Global map of the prevalence of symptoms of rhinoconjunctivitis in children: The International Study of Asthma and Allergies in Childhood (ISAAC) Phase Three. Allergy 2009; 64: 123148 |
|||
| Figure 1. Map of prevalence of current symptoms of rhinoconjunctivitis, 13- to 14-year age group. Allergy 2009; 64: 133 | |
Figure 2. Prevalence of current symptoms of rhinoconjunctivitis, 13- to 14-year age group. Countries are ordered by average prevalence. | view / download |
| Figure 3. Map of prevalence of current symptoms of rhinoconjunctivitis, 6- to 7-year age group. Allergy 2009; 64: 141 | |
Figure 4. Prevalence of current symptoms of rhinoconjunctivitis, 6- to 7-year age group. Countries are ordered by average prevalence. | view / download |
| Figure 5. Scatter plot of prevalence of current symptoms of rhinoconjunctivitis, both age groups. | view / download | ||
| Eczema | |||
| Odhiambo J, Williams H, Clayton T, Robertson C, Asher MI, and the ISAAC Phase Three Study group. Global variations in prevalence of eczema symptoms in children from ISAAC Phase Three. J Allergy Clin Immunol. 2009;124(6):1251-8. |
|||
| Figure1 World maps showing prevalence of current symptoms of eczema for the age group 6 to 7 years (A) and 13 to 14 years (B). Each symbol represents a center. Allergy Clin Immunol. 2009;124(6):1253 | Fig1A |
Fig1B |
|
| Figure 2. Ranked prevalence plots of current symptoms of eczema for the age group 6 to 7 years (A) and 13 to 14 years (B). Each symbol represents a center. Countries are ordered by average prevalence. | Fig2A |
Fig2B |
|
| Figure E2. World maps showing prevalence of current symptoms of severe eczema for the age groups 6 to 7 years (A) and 13 to 14 years (B). Each symbol represents a center. J Allergy Clin Immunol. 2009;124(6):1258.e4 | Fig.E2A |
Fig.E2B |
|
| FIG E3. Ranked prevalence plots of current symptoms of eczema for the age groups 6 to 7 years (A) and 13 to 14 years (B). Each symbol represents a center. Regions are ordered by average prevalence. | Fig.E3A |
Fig.E3B |
|
| FIG E4. Ranked prevalence plots of current symptoms of severe eczema for the age groups 6 to 7 years (A) and 13 to 14 years (B). Each symbol represents a center. Countries are ordered by average prevalence. | Fig.E4A |
Fig.E4B |
|
| FIG E5. Ranked prevalence plots of lifetime reported eczema for the age groups 6 to 7 years (A) and 13 to 14 years (B). Each symbol represents a center. Countries are ordered by average prevalence. | Fig.E5A |
Fig.E5B |
|
| FIG E6. Scatter plots illustrating prevalence by sex for current symptoms of eczema (A), current symptoms of severe eczema (B), and lifetime reported "eczema" (C) for the age group 6 to 7 years, and current symptoms of eczema (D), current symptoms of severe eczema (E), and lifetime reported "eczema" (F) for the age group 13 to 14 years. Each symbol represents a center. The line of equality is shown on each plot. | Fig.E6A-C |
Fig.E6D-F |
|